Change in Housing Affordability Indicators
The Change in Housing Affordability Indicators show how affordability of renting a home, saving for a deposit, and servicing a mortgage for people entering the market has changed over time. Each indicator compares price change with growth in median household income. They provide insight into affordability nationally, regionally, and by Territorial Authority.
- About the Indicators
- Affordability Indicators
- Indices
- Compare Regions
- Ways to measure housing affordability
Other ways to measure housing affordability
Housing affordability is about the ability to balance housing costs with available household financial resources so that individuals, families and whānau have enough income left over to pay for other necessities.
A variety of approaches are used based on conceptual and practical considerations.
Which measure is best suited for my purpose?
Different data sets and measures suit different specific research questions.
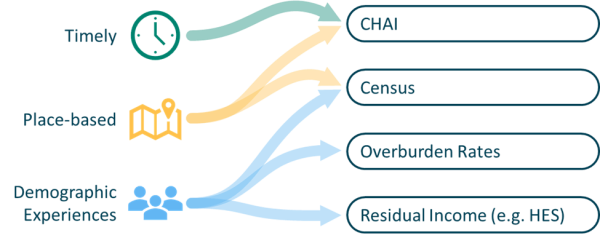
If you’re seeking to understand housing affordability through a place-based lens then census data and the CHAI are suitable. The CHAI are also the most timely measures available.
To access demographic breakdowns of housing affordability, the Household Economic Survey (overburden rates or residual income) and census are most suitable, but less timely than the CHAI.

A summary of New Zealand’s housing affordability statistics
|
Measure |
Merits |
Risks |
Data |
Breakdown |
|
Price-to-income ratios |
Simple.
Shows aggregate association between prices and incomes, over time and places. |
Lacks distributional information (e.g. who has/does not have access to affordable housing).
Wide choice of data sources mean results can differ.
Do not include housing quality, nor account for borrowing costs (except CHAI) |
Ubiquitous reports comparing aggregate income to house price and rental costs:
Stats NZ’s(external link) income, housing costs, and price data (Household Economic Survey - income and housing costs; Rental Price Index; Census - rent to income; example comparisons in Housing in Aotearoa 2020 report).
HUD’s Change in Housing Affordability Indicators (CHAI) includes mortgage serviceability and quality-adjusted price changes.
|
Tenure
Regions
High frequency |
|
Proportion of income on housing costs (‘overburden rates’) |
Intuitive; easy to explain.
Household level metric, so can be aggregated by demographic groups.
Widely used internationally so can be used for benchmarking. |
Threshold is arbitrary (30% + of income on housing costs is common rule-of-thumb)
Higher income households may be able to afford higher proportions (choose to consume more housing)
|
Stats NZ’s(external link) proportion of households spending more than 30 percent of disposable (after-tax) income on housing costs (from Household Economic Survey - HES).
DPMC(external link) Child Poverty Related Indicators (from HES).
OECD(external link) – cost overburden among low-income: tenants (private rent); owners with mortgage. |
Tenure
Children
Low-income |
|
Residual income |
Shows income after housing-costs
Useful to identify those at-risk of financial hardship |
Minimum income threshold is arbitrary
Can misdiagnose general cost-of-living problems as cost-of-housing problems
|
HES:(external link) Low-residual income after housing costs (aka (‘shelter poverty’).
HES(external link): Disposable income before and after housing costs, by income distribution and inequality measures (e.g. P90/P10 and Gini coefficient).
Stats NZ's(external link) Child poverty statistics show before/after housing costs poverty rates (housing costs induced poverty rates can be derived), by region and ethnicity. |
Regions
Children
Ethnicity (incl. Māori)
|
|
Subjective indicators |
Complements other measures of housing outcomes |
Perceptions may differ across individuals and over time |
General Social Survey.(external link)
|
Ethnicity (including. Māori) Tenure Ethnicity (including. Māori) Household composition Qualifications Employment Disability status Migrant status Age Region Urban/rural
|
|
Housing quality |
A related dimension to consider alongside affordability metrics. |
Housing quality is hard to define and changes over time |
HES: (external link) Cold, mould or damp, including by income quintile.
GSS:(external link) Cold, mould, damp, repairs/maintenance needed.
Overcrowding: HES and Census. (external link) |
Ethnicity (incl. Māori), Age, Sex, Region
|